Admin ToolsData Visualization / Project ManagementWhite-Label Readyv1.0.0

Interactive Timeline Visualizer

A production-ready Canvas 2D timeline visualization library that renders complex project roadmaps, startup timelines, and engineering sprints without any dependencies. Built with pure TypeScript, this Interactive Timeline Visualizer delivers smooth scroll-triggered animations, pan/zoom navigation, and multiple layout modes (horizontal, vertical, alternating, multi-lane swimlanes) while maintaining exceptional performance. Unlike typical timeline libraries that require React, D3, or heavy charting frameworks, this zero-dependency engine gives you complete control over rendering with a simple mount API and real-time configuration updates.

Built for Frontend developers and product managers building interactive project timelines, roadmaps, and Gantt chart alternatives for SaaS dashboards or team collaboration tools
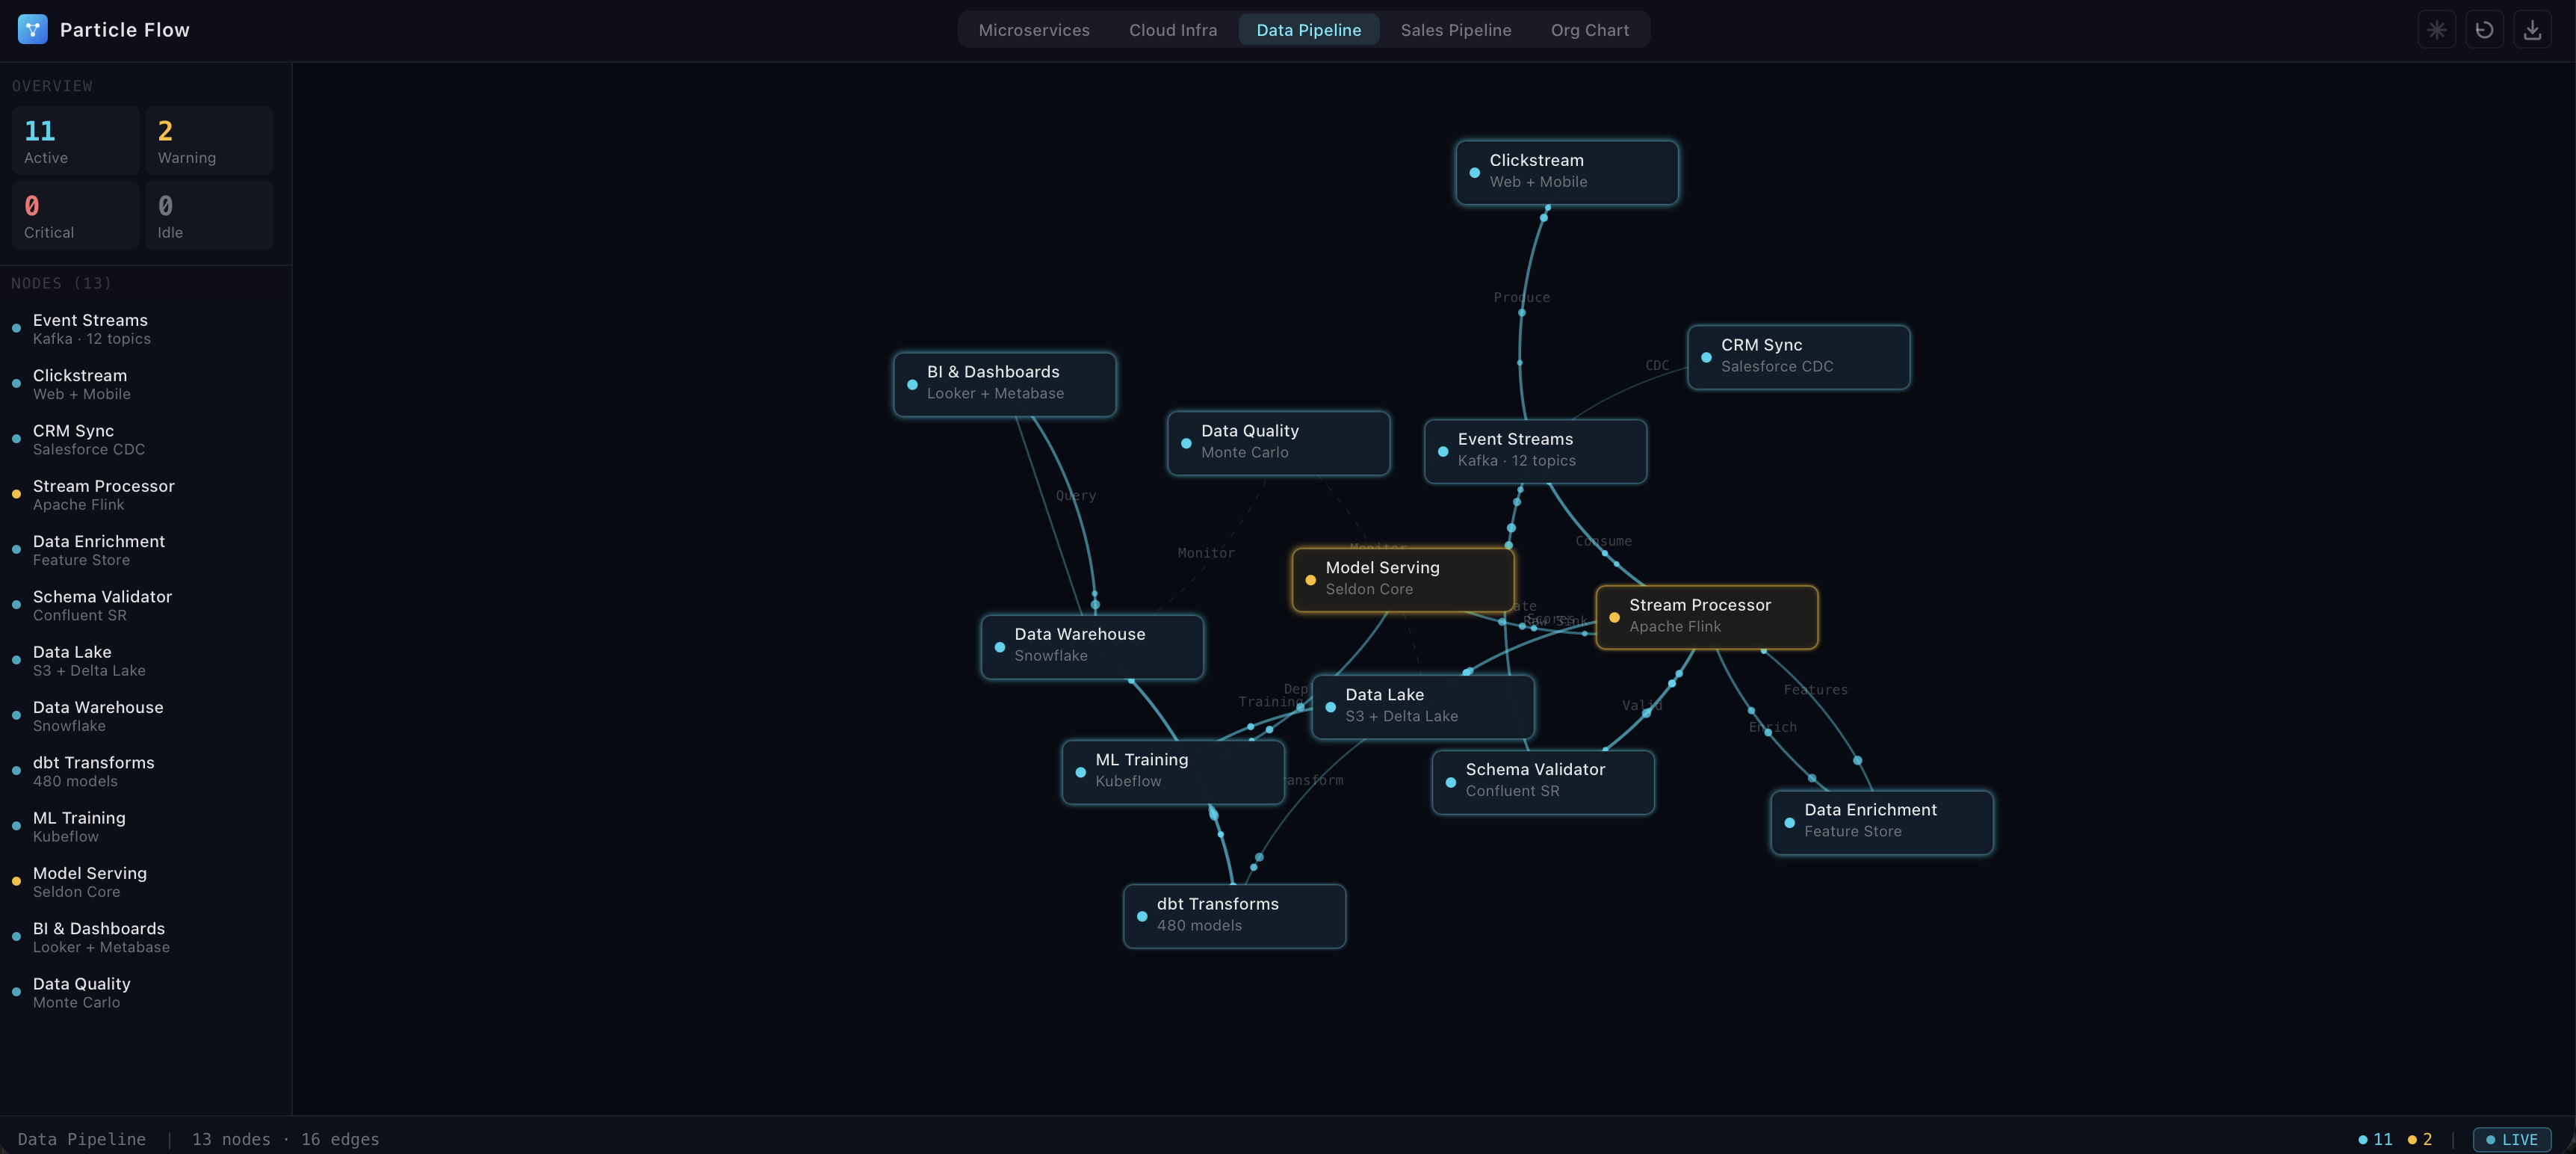
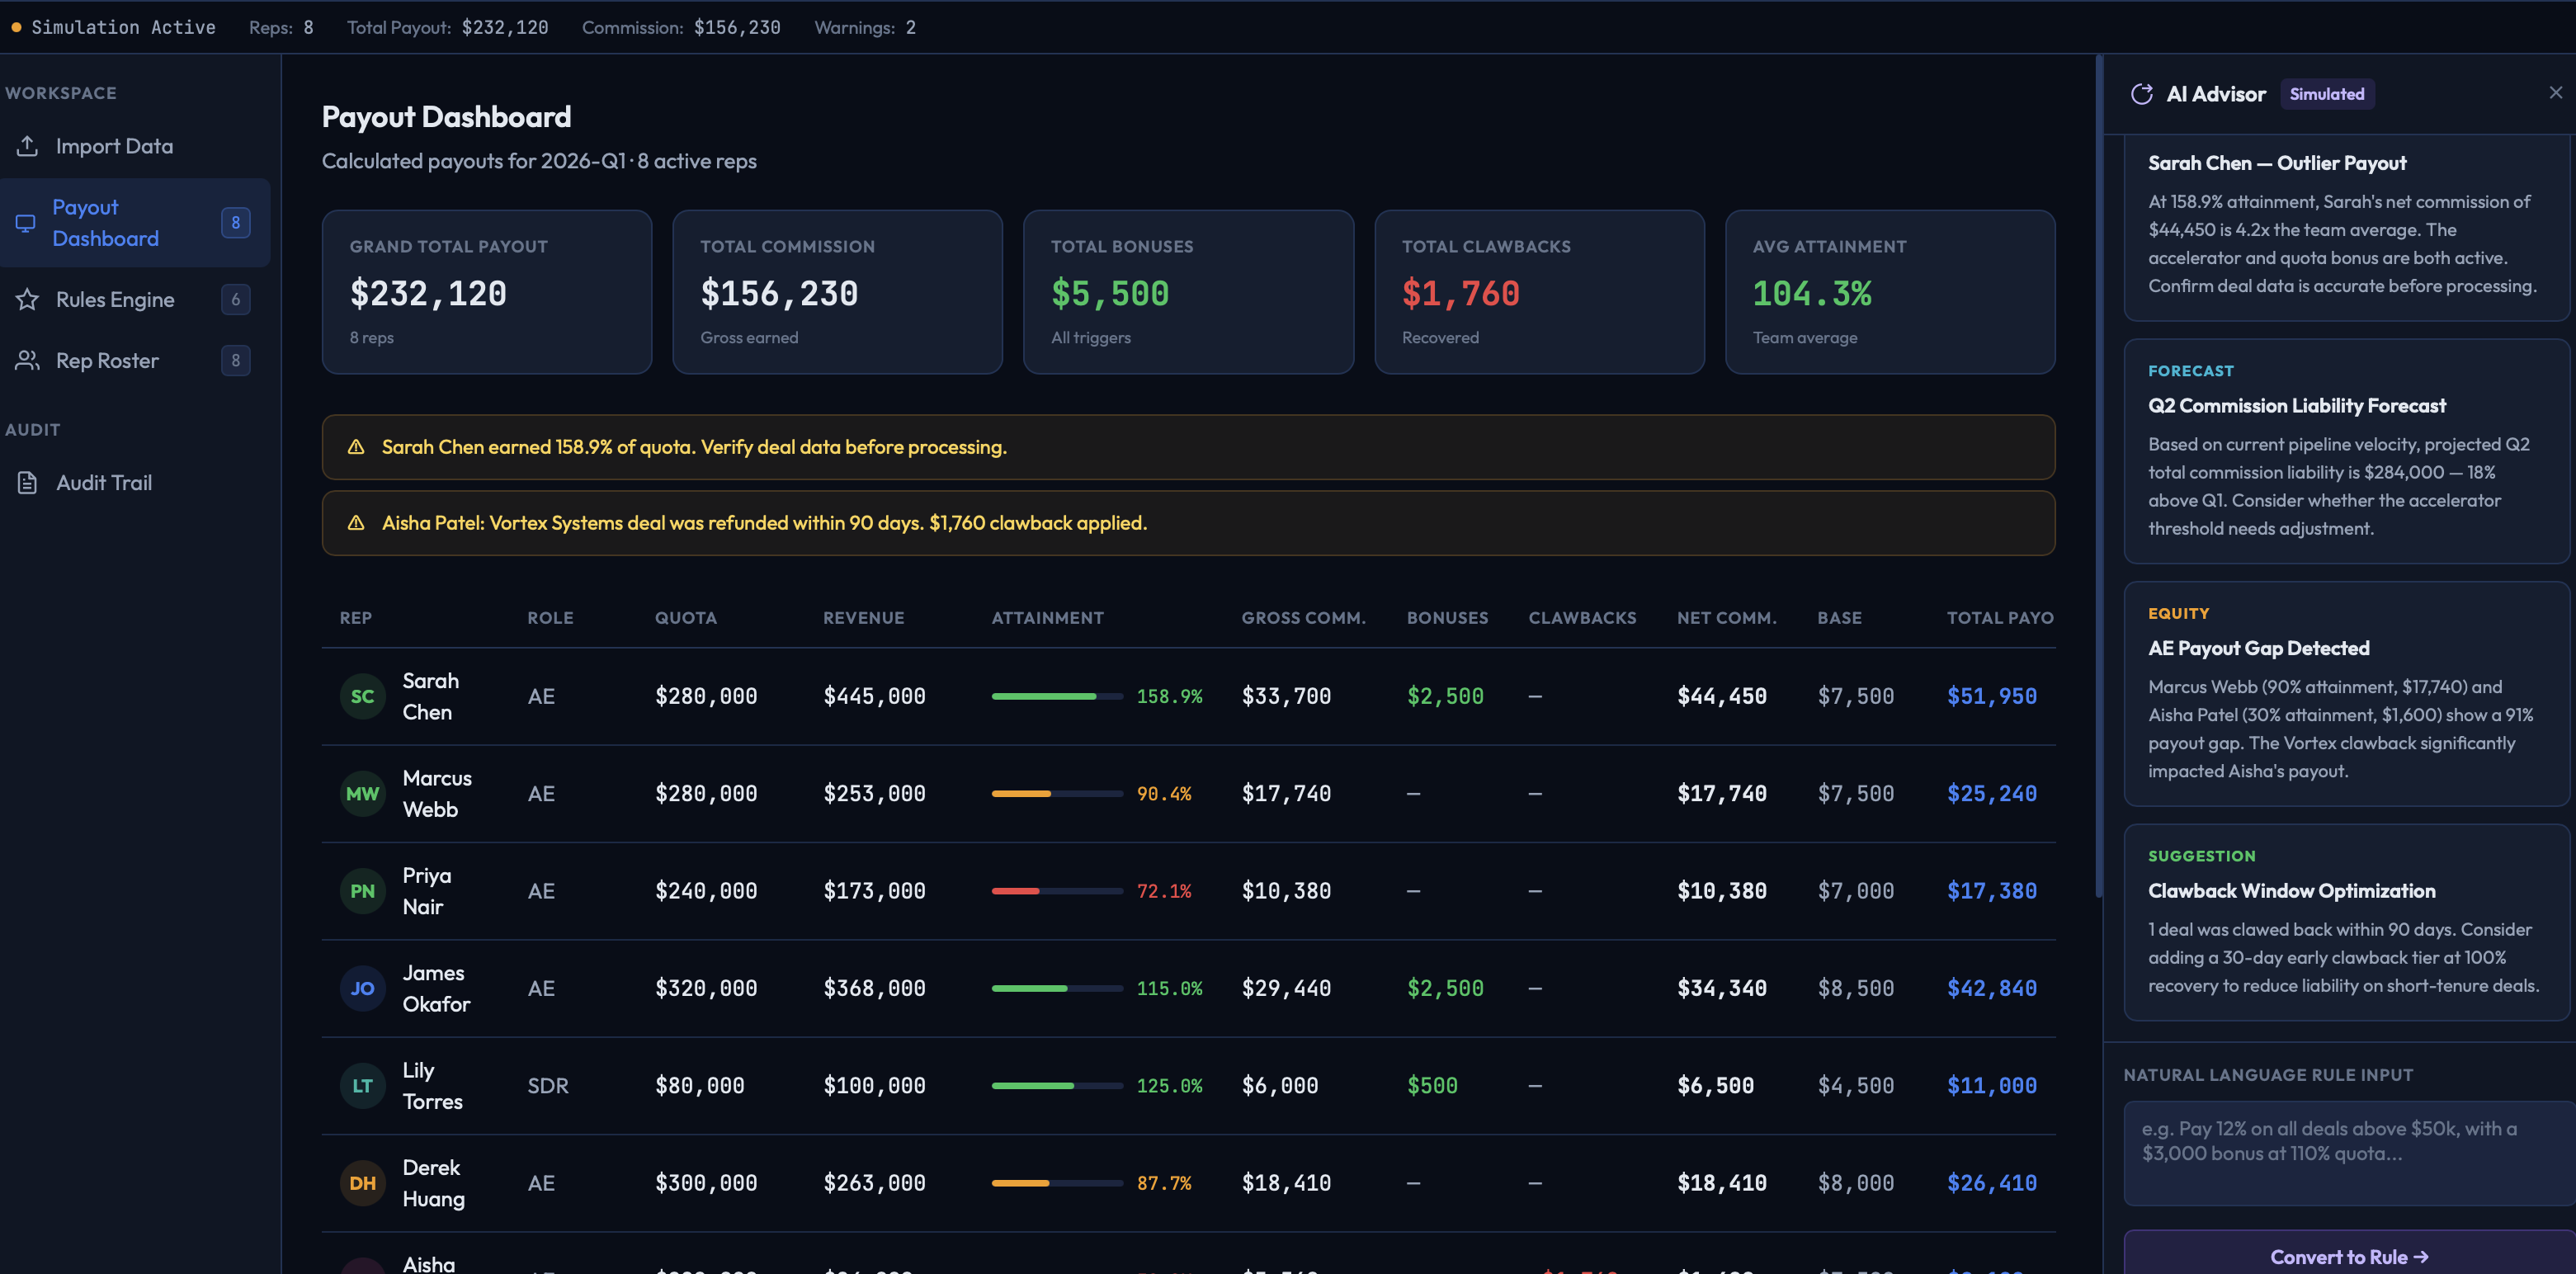
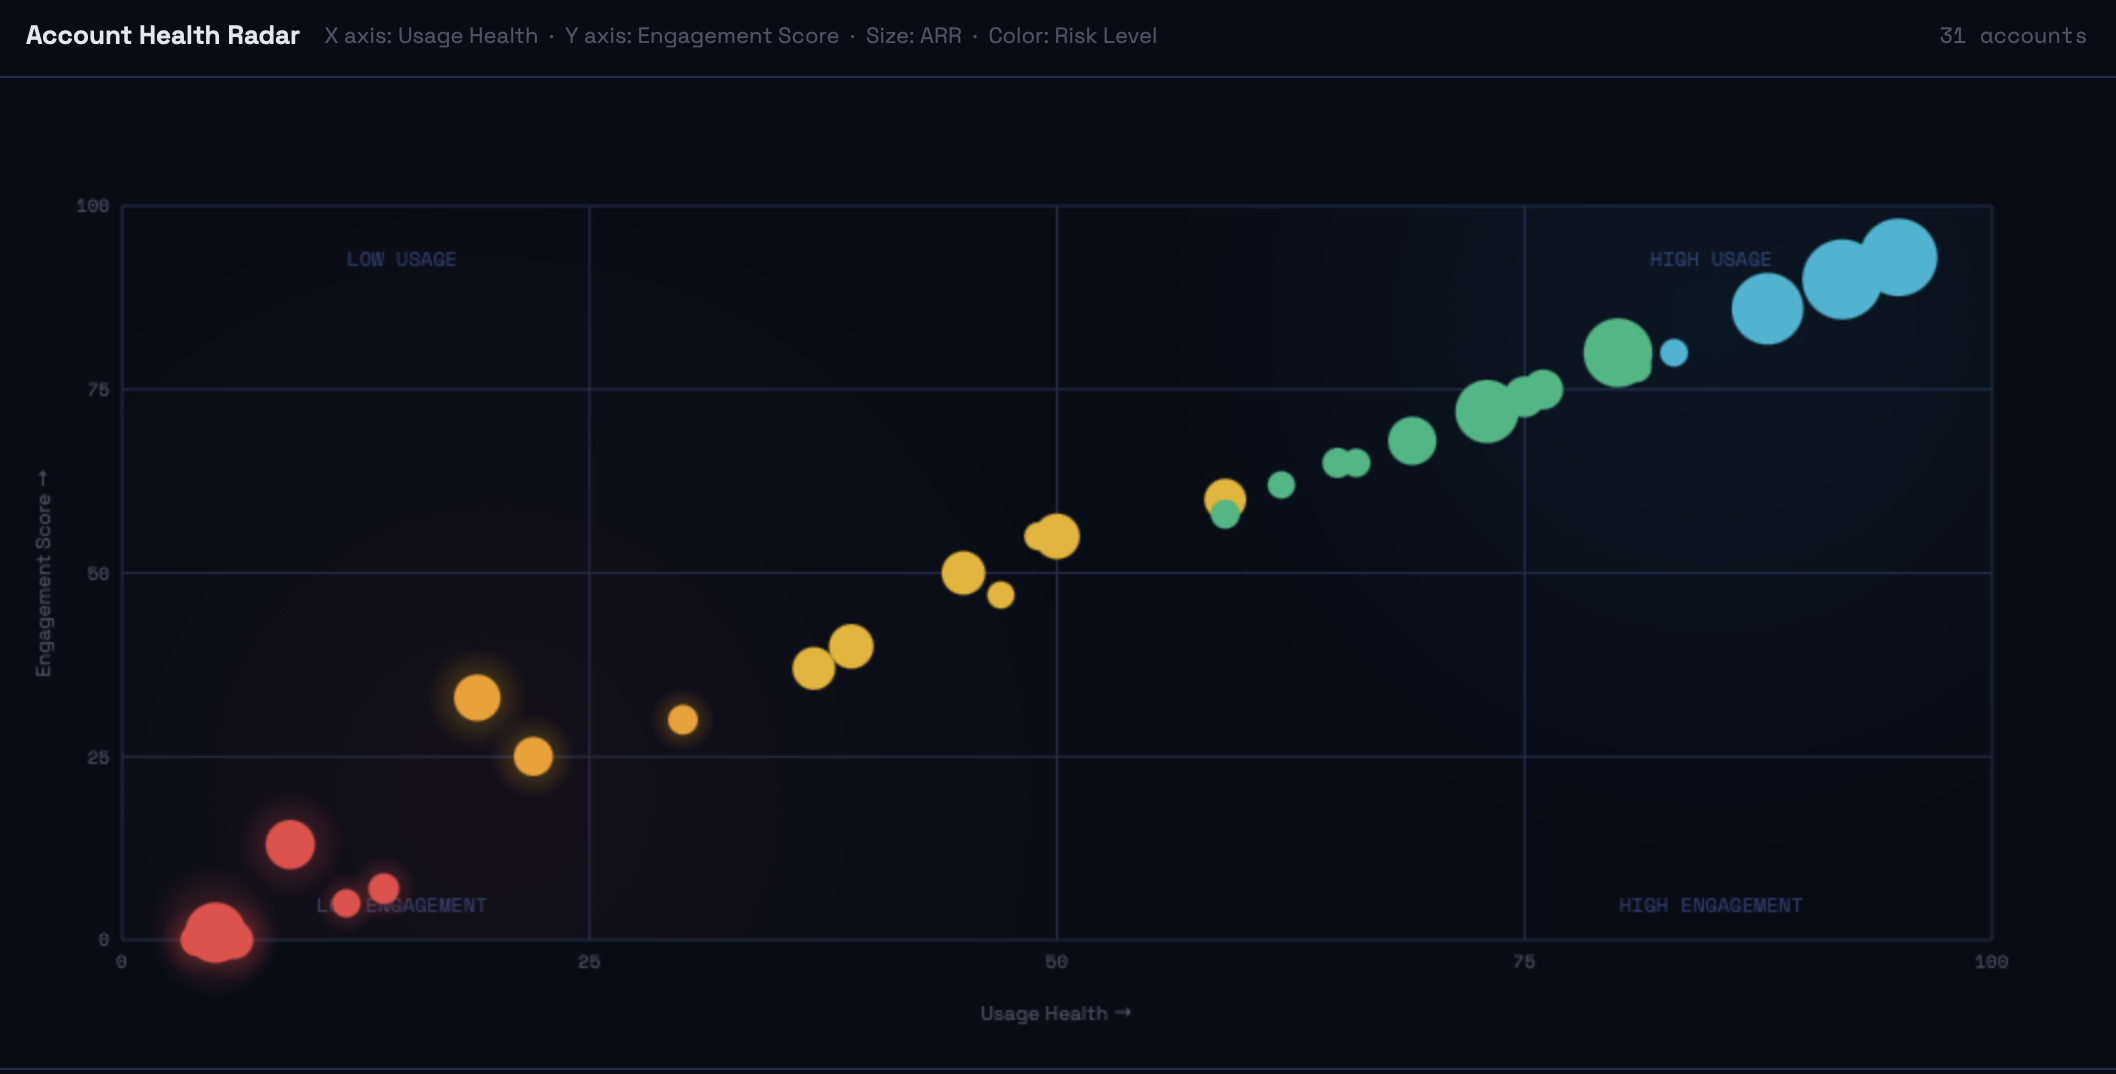
TypeScriptHTML Canvas APICSSJavaScript

Interactive Preview

Live frontend preview with mock data — the full product includes the complete source code and backend

The library includes a sophisticated four-module architecture: a Layout Engine that computes normalized coordinates for any timeline arrangement, an Animator that manages scroll-intersection observers and staggered entrance effects, a pure Canvas 2D Renderer for shapes and gradients, and a Controller that handles all user interactions through a clean state machine. The included AI adapter layer supports OpenAI, Anthropic, and Ollama for automated timeline analysis, critical path identification, and risk assessment — turning your roadmap visualization into an intelligent planning tool.

Ship with the complete source code including TypeScript definitions, four pre-built themes (Dark, Light, Midnight, Forest), a standalone preview.html with live controls, and framework integration examples for React, Vue 3, and vanilla JavaScript. The modular architecture makes it simple to extend with custom layouts, animation effects, or AI providers while the white-label theming system ensures perfect brand alignment through a single configuration object.

Features

Zero-dependency Canvas 2D rendering engine with pure TypeScript implementation
Four layout modes: Horizontal, Vertical, Alternating, and Multi-Lane swimlanes
Scroll-triggered entrance animations with configurable easing and stagger timing
Interactive pan, zoom, hover tooltips, and click event handling
Milestone dependencies visualization with automatic connector line rendering
Provider-agnostic AI adapter for OpenAI, Anthropic, and Ollama integration
Type-safe TypeScript API with comprehensive type definitions
Progress rings and status indicators for milestone tracking
Modular architecture with separate layout, animation, and rendering engines
Built-in themes (Dark, Light, Midnight, Forest) with full customization

What This Solves

Project roadmap visualization for engineering teams tracking sprints and dependencies
Startup launch timeline presentations for investor pitch decks and team alignment
Historical event visualization for educational platforms and interactive learning
Product release timeline for marketing teams showcasing feature rollouts
Milestone tracking dashboards for project managers monitoring critical paths
Interactive Gantt chart alternative for agile teams visualizing sprint progress
Company history timeline for corporate websites and annual reports
Research timeline visualization for academic papers and grant proposals

How to Integrate

4 integration paths from simple to advanced. Full guide included with your purchase.

1

Vanilla JavaScript

2

React Integration

3

Vue 3 Integration

4

AI Adapter Integration

Complete integration guide with code examples included with purchase

White-Label Ready

Rebrand completely and deploy under your own name for your clients.

Replace logos, colors & fonts
Use your own domain & branding
Connect your own payment processor & database
Deploy for unlimited clients
BRANDING.md guide included
Full commercial rights

What's Included

Everything you need to ship — no surprises.

Zero-dependency Canvas 2D timeline rendering engine (TypeScript)
Four timeline layout engines: horizontal, vertical, alternating, and multi-lane swimlanes
Scroll-triggered animation system with configurable easing and stagger effects
Interactive pan/zoom controller with hover tooltips and click event handlers
AI adapter layer supporting OpenAI, Anthropic, and Ollama for roadmap health analysis
Production-ready preview.html with live controls panel and three demo scenarios
White-label theming system with four built-in themes (Dark, Light, Midnight, Forest)
Complete TypeScript type definitions and modular architecture documentation
White-label commercial rights

Get Interactive Timeline Visualizer

Buy OnceSubscribe

One-Time Purchase

Pay once, own forever

$69one-time
  • Full source code
  • GRID_AI_CONTEXT.md included
  • 12 months of updates
  • Commercial license
  • White-label rights

Subscription

Access this tier's entire catalog

$25/month
  • Everything in one-time
  • Access all internal admin products
  • Continuous updates forever
  • Cancel anytime

More from this category

Particle Flow Network
View Details →
White-Label
Admin ToolsData Visualization

Particle Flow Network

A production-ready React visualization component for rendering interactive node-graph networks with 60fps particle animations — built for developers who need to visualize complex systems like microservices architectures, data pipelines, or organizational structures in real-time. Unlike typical network visualization libraries that render static diagrams, Particle Flow Network brings your system topology to life with flowing particles that represent actual traffic, animated status indicators showing service health, and a physics engine that creates organic, breathing layouts. Ships as a complete React 18 + TypeScript application with Canvas-based rendering, customizable physics simulation, WebSocket support for live updates, and comprehensive white-labeling options — drop it into any React dashboard in 15 minutes or build a standalone monitoring tool your ops team will actually use.

Microservices Architecture:** Visualize traffic between services, databases, and APIs in your ops dashboard.Data Pipelines:** Monitor ETL jobs, Kafka streams, and ML training runs in real-time.Sales & Lead Flow:** Watch leads move through stages and identify drop-offs in your internal CRM.
Commission & Payroll Calculator
View Details →
White-Label
Admin ToolsAccounting

Commission & Payroll Calculator

Production-ready TypeScript commission calculation engine that replaces error-prone spreadsheets with deterministic, auditable commission processing for sales operations and payroll teams. Built for organizations managing complex commission structures with tiers, accelerators, bonuses, and clawbacks, this enterprise-grade calculator handles the scenarios that break traditional spreadsheet formulas — from mid-period rate changes to retroactive adjustments. Ships with a zero-dependency TypeScript core, CSV import/export pipelines, AI-powered anomaly detection adapter, and complete integration guides for REST APIs, WebSocket feeds, and data warehouses. Download includes the full calculation engine source, provider-agnostic AI layer, standalone HTML preview with three industry scenarios, and comprehensive documentation for embedding into Salesforce, HubSpot, or custom admin panels.

Monthly commission calculations for SaaS sales teams with tiered quotasReal estate agency payouts with split commissions and bonus structuresRetail franchise commission tracking across multiple locations
Churn Risk Identifier
View Details →
White-Label
Admin ToolsHR

Churn Risk Identifier

Production-ready customer churn risk identification dashboard that transforms Customer Success operations by automatically scoring 50-150 accounts through multi-system data aggregation. Unlike basic health scoring tools that rely on single data sources, this TypeScript-powered solution pulls from Salesforce, HubSpot, Mixpanel, Zendesk, and Gainsight to create a comprehensive risk profile visualized through an intuitive Canvas 2D scatter plot. Built for CS teams managing large portfolios, it surfaces at-risk accounts before renewal deadlines using deterministic scoring algorithms that analyze usage patterns, engagement metrics, support tickets, and NPS data. The modular adapter pattern allows seamless integration with your existing tech stack while the AI advisor component provides portfolio-level insights to prevent churn at scale.

Identify customers at risk of churning before renewal dates using multi-source data correlationPrioritize customer outreach for 50-150 account portfolios based on quantified risk scoresVisualize entire customer portfolio health through interactive Canvas 2D scatter plots

Disclaimer: This product is sold as-is under the Grid Theory Library Terms. All purchases are final. Products are delivered as source code and are intended for use by developers and technical teams. Grid Theory makes no guarantees regarding fitness for a particular purpose, uptime, or compatibility with third-party services. The interactive preview shown on this page uses mock data and may not represent the full functionality of the delivered product. White-label rights, where applicable, permit rebranding and redistribution under the terms of the license agreement — resale of the original source code as a standalone product is prohibited. By purchasing, you agree to the Terms of Service and Privacy Policy.

We use cookies to analyze site traffic and improve your experience. By accepting, you consent to the use of cookies for analytics and advertising purposes.